|
a free and open toolkit for 2d/3d seismic data analysis |
|
kogeo seismic toolkit |


|
Contact:
|
|
Phone (home): +49 - 40 - 2780 7890 Phone (office): +49 - 40 - 42838 5234 Fax: +49 - 40 - 42838 7081 E-Mail: konerding@geowiss.uni-hamburg.de |
|
Features |
|
The 3d-visualization functions within kogeo are only available when a project database is active; they’re represented by five buttons (1-5, from left to right) of the project toolbar:
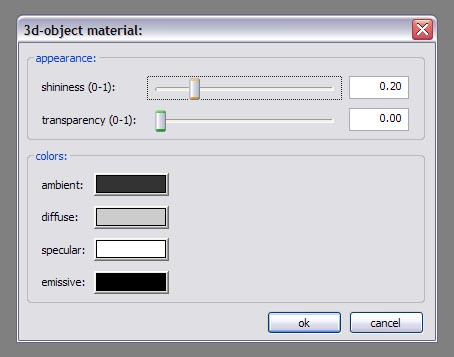
To start the 3d visualization mode press the ‘Toggle 3d-view’ button (1). This will bring up the 3d-view as the third view of the current session. In general every data that is displayed in the other views will be displayed in the 3d-view as well. A 3d-view can be refreshed using the ‘Refresh 3d-view’ button (4). Every object (e.g. a vertical profile or a time slice) that is part of a 3d-scene has it’s own material parameters. These can be edited in the following way: First, activate the window that contains the object of interest (in 2d). If the activated window contains valid content the button ’3d-objects material’ (3) will be available. It will open the ‘3d-object material’ dialog window:
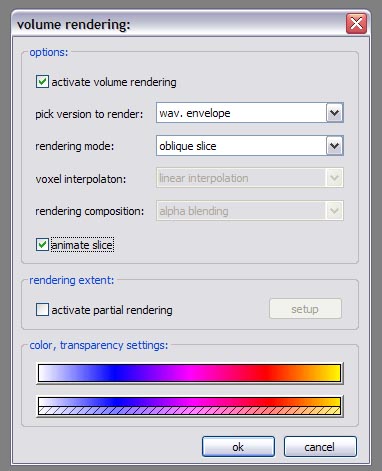
In the upper part you can adjust the ‘shininess’ and ‘transparency’ of 3d-objects, in the lower part colors are defined that affect their optical behavior. The default colors are the ones used by default in Coin3d/Open Inventor. When the dialog window is closed using ‘ok’, the changes will be applied to the 3d-scene automatically. The quality (and accuracy) of the display of transparent objects depends strongly on the active transparency mode; A displaying mode that is exclusively available in a 3d-view is volume rendering; it is activated using the ‘Volume rendering options’ button (2) which will bring up the ‘Volume rendering’ dialog:
To start volume rendering activate the checkbox at the top of the dialog. Then choose the data version you want to be rendered and a ’rendering mode’. At the moment, there are three rendering modes available: skin, volume and oblique slice. In ’skin’ mode, only the six outsides of the data volume are rendered; since this is much faster than volume rendering for example, you might want to use this function to setup the extents of data to render before switching to ‘volume’ mode. If the ‘rendering mode’ is set to ‘volume’, two additional parameters will be available: ‘voxel interpolation’ and ‘rendering composition’. The first affects the display quality in a similar way like the ‘image interpolation mode’ setting for 2d-displays, the latter sets the way voxels are displayed in partly transparent volumes. The default value ‘alpha blending’ composes voxels by their opacity and voxels behind others with a high opacity will be obscured. In ‘max. intensity’ mode only the voxel with the highest opacity along a projection ray will be rendered, in ‘sum intensity’ mode the opacity of all voxels along a projection ray will be summed up. The third rendering mode ‘oblique slice’ displays a single slice through the dataset. It can be freely moved and rotated by clicking on the dragger tool that is displayed with the slice itself (choose the arrow tool of the 3d-view to do so). Clicking on one of the (transparent) sides of the dragger allows for translations, clicking on the dragger frame allows for rotations of the slice. You can toggle the dragger on and of by using the D-key; Ctrl-D resets the slice back to it’s original position. If the ‘animate slice’ option is activated, it will be displayed during dragger movements; you might switch this off if graphics performance is a problem. If you choose the ‘activate partial rendering’ option, you might specify a sub-volume to restrict the rendering extent by clicking the ‘setup’ button. In the lower part of the dialog window, the color and transparency/opacity settings for the rendered volume can be adjusted. The colorbar (upper button) is set to the default of the data version you have chosen to render in the beginning and might be changed afterwards. The lower button starts the transparency/opacity setup for the colorbar:
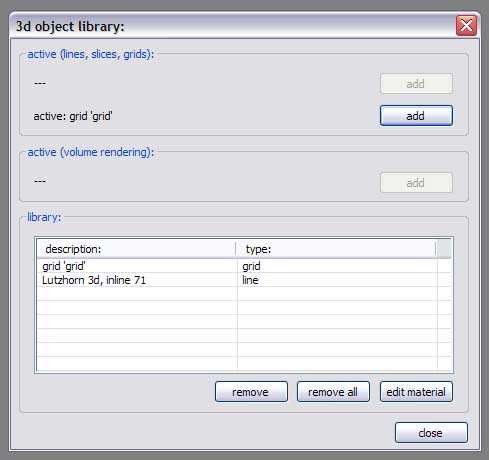
First specify opacity values for the left and right ends of the colorbar in the fields of the upper section of the dialog window (all opacity values have to be in the range of 0-1, i.e. completely transparent to completely opaque). Afterwards, additional opacity nodes can be added in the middle section of the dialog window; they will appear in the list below, from where they can be deleted using the ‘remove value’ or ‘remove all’ buttons. Every change to the opacity settings will be immediately visible in the control window below the slider. You might save or restore transparency/opacity settings to/from disk using the ‘save t.def.’ and ‘load t.def.’ buttons in the lower part of the dialog window. The 3d scene will basically contain all the objects that are displayed in the 2d windows of your session. Additionally you might add objects to the 3d object library to have them displayed in the 3d scene independently. To do so, activate the window that contains the object you want to add to the library and press button 5 (‘3d object library’) to bring up the following dialog window:
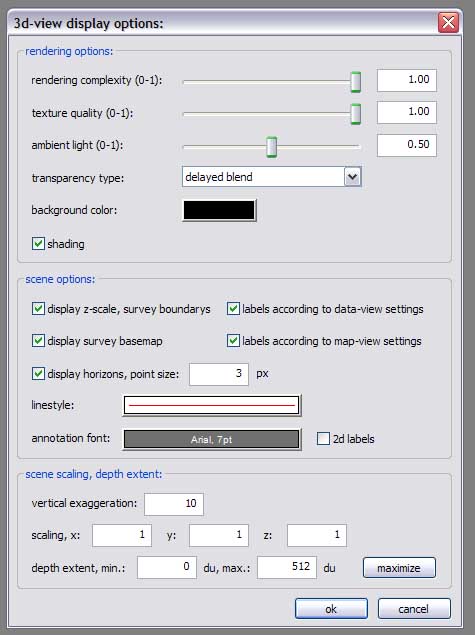
In the upper part you will see a short description of the available 2d object and/or a volume rendering. You can add these to the library by using the ‘add’ buttons; afterwards the object will appear on the list in the lower part of the dialog window. Objects can be deleted from the list or their material can be edited by unsing the ‘remove’, ‘remove all’ and ‘edit material’ buttons - just select an item from the list before. If a 3d-view is activated, the ‘Display options’ button of the ‘Data toolbar’ (see: user interface) will open the ‘3d-view display options’ dialog:
In the upper part general rendering parameters can be edited; ‘rendering complexity’ and ‘texture quality’ values might be lowered to enhance rendering speed, ‘ambient light’ sets the scene-wide amount of direction-less light. The ‘transparency type’ parameter can be set to the various transparency modes offered by the Coin3d visualization library, each of which has it’s own advantages and disadvantages (speed, accuracy, etc.). The background color of the 3d-scene can be set using the corresponding button. By deactivating the ‘shading’ option, you can switch off the effects of lighting on the rendered scene. The middle section of the dialog window deals with optional things to include or not into the 3d-scene; you can display and label a z-scale and/or the survey basemap using the specified linestyle and labeling font. The ‘display horizons’ option is applying to active (for picking) horizons only; the picks are colored according to the ‘horizon z-value’ colorbar of the data toolbar and displayed in the specified size. In the lower section of the dialog window the scene scaling and depth extent can be edited. Changing the ‘vertical exaggeration’ is preferable over using the z-scale factor, since this seems to have an affect on shading. The depth extent can be specified in depth units (milliseconds), things that are out of this range will not be displayed. |
Read more about... |
|
...3d visualization |
|
You‘re visitor no.: |
|
Home |
|
About kogeo |
|
Features |
|
Download |
|
Building instructions |
|
Guestbook |
|
Home |
|
About kogeo |
|
Features |
|
Download |
|
Building instructions |
|
Guestbook |